
Comission Disclosure
AMFI REGULATORY DISCLOSURE / ARN-188499 / SEBI CIRCULAR NO. SEBI/HO/IMD/DF2/CIR/P/2018/137
Statutory Brokerage & Commission Disclosures
Complete Transparency in Mutual Fund Distribution, Trail Remuneration Structure & Disciplined Long-Term Investor Handholding.
AMFI REGISTERED
ARN-188499
ACCREDITATION
QPFP® Certified
INVESTOR COST
Zero Direct Fees
PAYMENT MECHANISM
Direct AMC Trail Payout
STATUTORY CATEGORY-WISE STRUCTURE
SEBI Mandatory Brokerage Disclosures
In accordance with SEBI circulars and AMFI Code of Conduct, below is the standard range of gross commission (trail brokerage) payable across various mutual fund categories distributed through our Financial Services.
BALANCED & DYNAMIC
Hybrid Funds
Conservative, Aggressive, Balanced Advantage, and Multi-Asset allocation
schemes.
Gross Trail Commission Range
0.125% – 1.814%
Per annum on average daily AUM
GROWTH & COMPOUNDING
Equity Funds
Large Cap, Mid Cap, Flexi Cap, Small Cap, Sectoral, and ELSS Tax-Saver schemes.
Gross Trail Commission Range
0.061% – 1.829%
Per annum on average daily AUM
CAPITAL PROTECTION
Debt Funds
Corporate Bond, Short Duration, Money Market, Banking & PSU, and Target Maturity.
Gross Trail Commission Range
0.005% – 1.132%
Per annum on average daily AUM
LIQUIDITY & PASSIVE
Other Funds
Liquid Funds, Overnight Funds, Index Funds, ETFs, and Fund of Funds (FoF).
Gross Trail Commission Range
0.005% – 1.227%
Per annum on average daily AUM
Tailored financial solutions contact us today for guidance.
Understanding Mutual Fund
Trail Commission
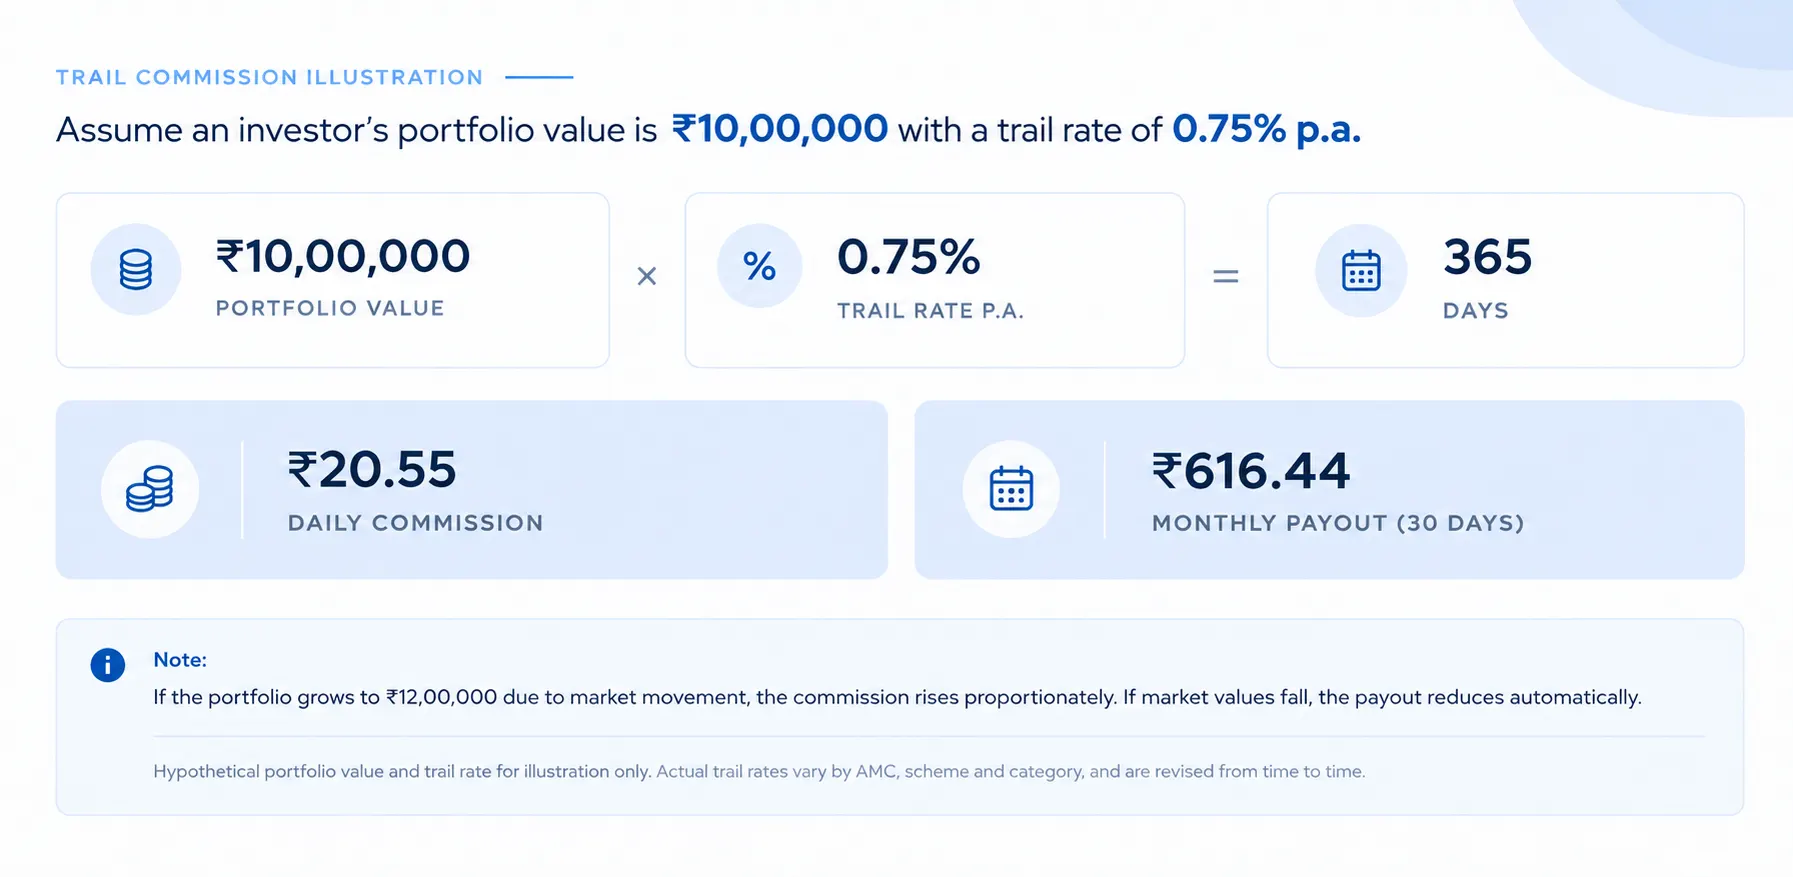
There is often confusion about how mutual fund distributors earn commissions. This calculator is designed to make the trail commission structure easier to understand through simple, illustrative calculations.
What is trail commission?
When you invest through a Regular Plan, the mutual fund distributor may receive trail commission from the Asset Management Company (AMC). It is generally linked to the assets under management (AUM) and the applicable scheme-specific commission rate. It is not a separate bill paid directly by the investor to the distributor.
Are funds selected just for commission?
No. A fund should be selected based on the investor’s goals, risk profile, investment horizon, asset allocation and other relevant scheme and AMC factors—not simply on the commission it pays. Commission rates can differ across schemes and may change over time.
Why does the commission amount grow over time?
Trail commission is generally calculated on the applicable assets under management. As a portfolio grows, the amount may increase; if its value falls or the applicable rate changes, the commission may decrease. A larger long-term figure reflects an ongoing investment relationship and accumulated assets—not necessarily a large upfront earning from one investor.
What does ongoing hand-holding involve?
The value of an MFD relationship goes beyond starting a SIP. It can include:
- check_circleAligning investments with financial goals
- check_circleReviewing asset allocation and portfolio progress
- check_circleHelping investors navigate market volatility
- check_circleEncouraging disciplined decisions and avoiding emotional reactions
- check_circleReviewing investments as goals and circumstances change
Transparent Fee Architecture
Zero direct billing. Everything flows through institutional AMC accounting strictly within SEBI TER limits.
Investor Invests at NAV
Client capital is invested directly into AMC schemes at the prevailing Net Asset Value (NAV). 100% of the allocated capital enters units.
AMC Deducts Statutory TER
The AMC deducts the Total Expense Ratio (TER) daily from the scheme's net assets, covering fund management, custody, audit, and distribution.
AMC Remits Trail to MFD
The AMC disburses the trail commission from the TER pool to NABHA Financial Services for ongoing periodic reviews, handholding, and reporting.
Investment Journey & Handholding Calculator
Simulate realistic multi-decade compounding, compare Regular vs Direct cost spreads, and see the exact daily trail compensation earned over decades of continuous handholding.
Includes realistic cyclical drawdowns (e.g. -6% in Yr 3, -8% in Yr 9) to display real rupee-cost averaging unit accumulation.
*The cumulative trail figure represents 15-30 years of daily continuous monitoring, compliance reporting, rebalancing, and emotional anchoring. It is never an upfront deduction.
| Financial Goal | Schemes | Monthly SIP | Lump Sum | Est. Maturity Value |
|---|
The difference between Regular Plan and Direct Plan is the exact trail remuneration paid by the AMC to the MFD for advisory handholding.
| Scheme | Regular TER | Direct TER | Difference (Spread) | MFD Trail Brokerage |
|---|
Witness how negative return years turbocharge unit accumulation via rupee-cost averaging.
| Year | Year Return | Invested (Cum.) | Units Added | Ending NAV | Portfolio Value | AMC Trail Fee |
|---|
**Disclaimer:** The figures generated by this calculator are illustrative estimates based on the inputs provided, assumed market returns, investment tenure, expense ratios, applicable tax considerations, and estimated trail commission structures. Actual investment returns, taxation, expenses, and commission rates may vary depending on the scheme, AMC, distributor agreement, investor profile, prevailing regulations, and individual circumstances. Commission rates and remuneration structures may differ across mutual fund distributors and are subject to applicable SEBI and AMFI guidelines. The calculator does not guarantee returns or constitute investment or tax advice. Investors should consult a qualified financial professional for personalized guidance.
See How SIP Works in a Volatile Market
Explore how a fixed monthly investment buys different numbers of units as NAV moves up and down.
Set up your SIP journey
NAV paths are hypothetical and are used only to demonstrate rupee cost averaging. They are not market forecasts or actual fund data.
Your SIP at a glance
Monthly investment journey
| Month | NAV (₹) | SIP (₹) | Units bought | Total units | Portfolio value (₹) |
|---|
For this demonstration, each SIP is assumed to be invested at that month's illustrative NAV, with no taxes, transaction charges or exit load included. Real investment values can rise or fall.
TER: understand the scheme expense ratio
TER is the scheme's total expense ratio. It is not the same as an individual distributor's trail commission. Refer to the AMC's latest scheme documents for current TER and details.
Mutual fund investments are subject to market risks. Read all scheme-related documents carefully.
What Ongoing Handholding Involves
The value of a mutual fund distributor relationship extends far beyond initiating an investment. It is anchored in continuous guidance, behavioral discipline, and life-stage alignment.
Aligning Investments with Financial Goals
Mapping capital to specific milestones—child education, retirement, family security—rather than speculative chasing of short-term returns. Portfolios are structured with defined horizons and liquidity contingencies.
Reviewing Asset Allocation and Portfolio Progress
Periodic rebalancing and asset allocation reviews to ensure risk exposure matches evolving time horizons. Preventing accidental concentration in overperforming sectors and re-anchoring to risk tolerance.
Helping Investors Navigate Market Volatility
Acting as a steady behavioral anchor during sharp market corrections, preventing panic redemptions. Maintaining conviction when headlines are turbulent preserves compound growth trajectories.
Encouraging Disciplined Decisions
Guiding clients through market noise, greed at market peaks, and fear during downturns. Ensuring systematic SIP continuity without arbitrary market-timing interruptions that erode long-term compounding.
Reviewing Investments as Circumstances Change
Re-evaluating financial plans when income, family responsibilities, health priorities, or regulatory conditions change. Proactive assistance with nomination updates, transmission processes, tax efficiency, and smooth cross-generation wealth transfer.

Goal-based wealth advisory and personalized financial architecture. Cultivating discipline, clarity, and peace of mind for families and enterprise leaders.
Quick Links
Contact
- +91 9699955448
- nabhafs@gmail.com
- Pune / Maharashtra, India
Regulatory Disclaimer: Mutual Fund investments are subject to market risks. Please read all scheme-related documents carefully before investing. Nilesh Vadnere is an AMFI Registered Mutual Fund Distributor (ARN-188499). Registration granted by AMFI and certification by QPFP in no way guarantee the performance of schemes or provide assurance of returns to investors.
© 2026 NABHA Financial Services. All rights reserved.